
Decoding Carbon Data for a Sustainable Future
As the primary sustainability partner for Spain's business sector, the Fundación Empresa y Clima (FEC) helps organisations navigate the transition to a low-carbon economy in line with the Kyoto Protocol and Paris Agreement. They don't just advocate for change; they engineer the tools to measure it.
Helios is the Foundation's flagship SaaS platform. It is the engine room where companies input their yearly activity data to calculate their official carbon footprint. It handles complex emission factors serving as the single source of truth for corporate environmental auditing in Spain.
The Context: High Stakes, Low Visibility
The Client
Fundación Empresa y Clima (FEC)
The Mission
Helping companies across Spain calculate and report their Greenhouse Gas (Scope 1, 2, and 3) emissions.
Carbon reporting is notoriously complex. It involves thousands of data points—from biomass combustion to waste disposal logistics. The client's existing platform, Helios, was robust in calculation but fragile in usability. It was a "Legacy Labyrinth": a text-heavy, unstyled system where users navigated blindly through endless trees of folders.
LEGACY SYSTEM AUDIT // STATUS: CRITICAL
ERRORUser flow requires 7+ clicks to locate Scope 3 forms. Cognitive load exceeds threshold.
Zero state feedback. Users cannot distinguish between [Empty], [Pending], or [Finalized] data.
Role confusion detected. Administrators lack global visibility permissions.
Platform Architecture
Key interventions designed to simplify GHG reporting.
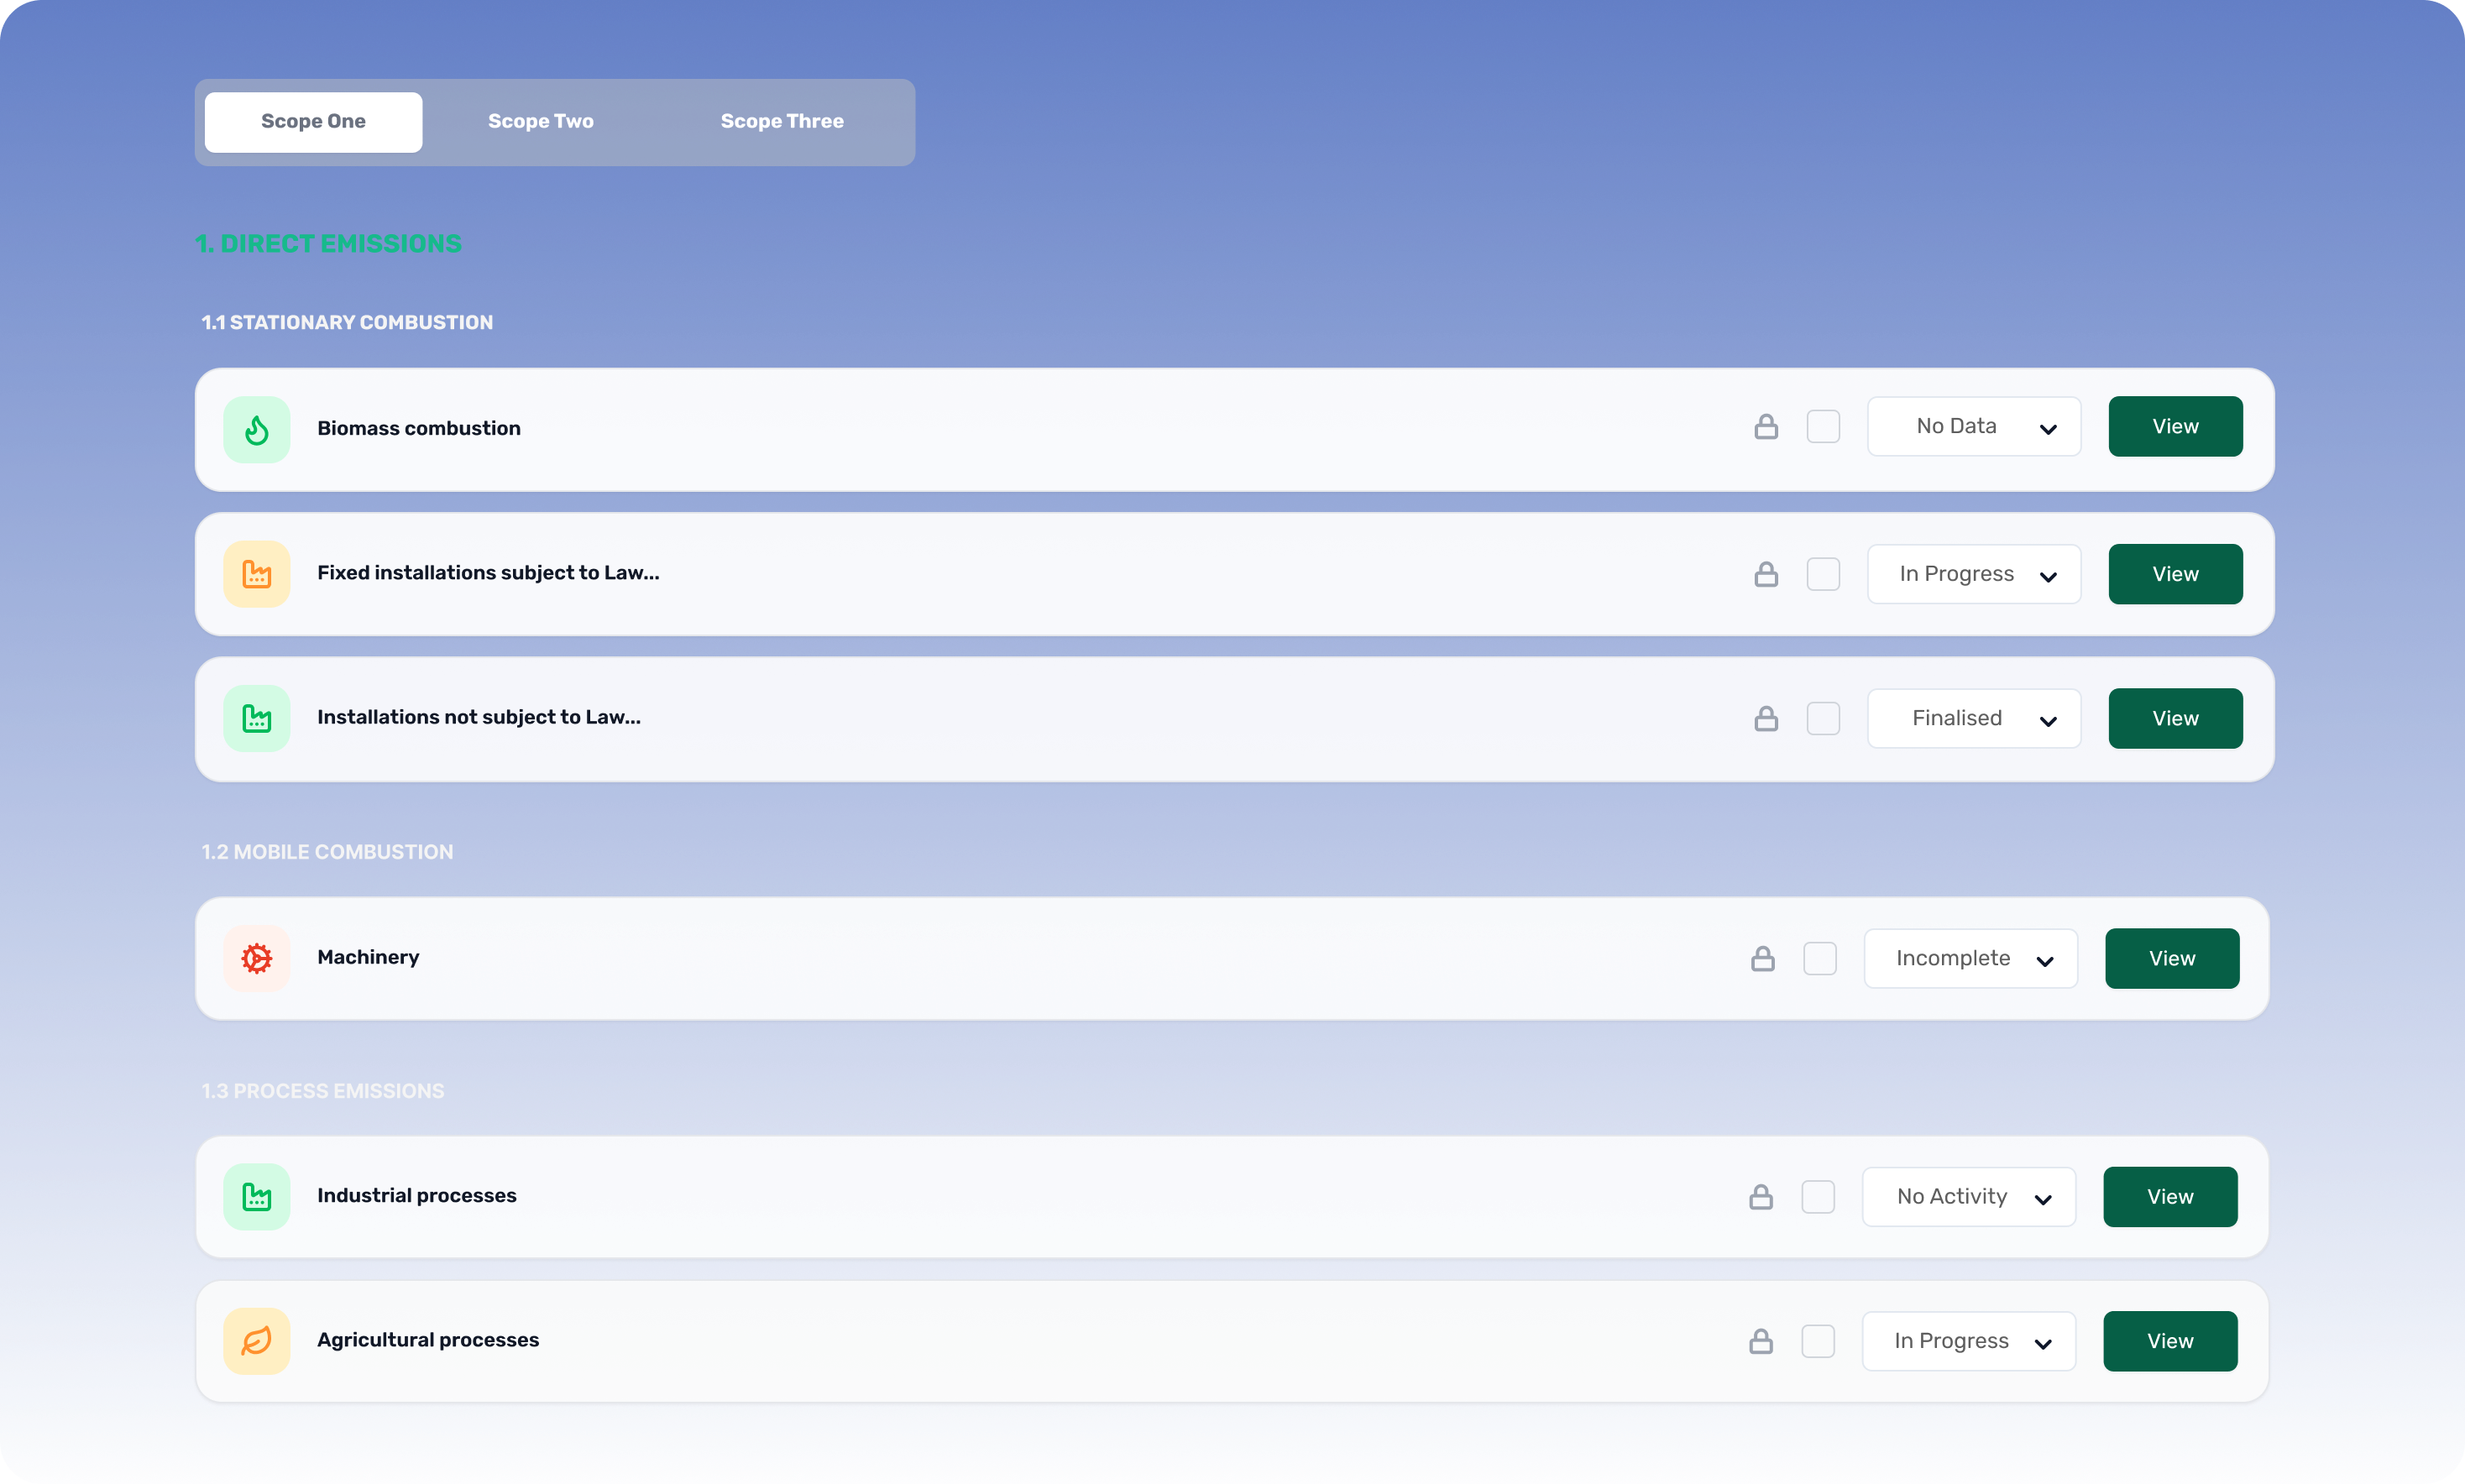
Scope-Based Navigation
We organized the complex GHG reporting standards into a linear sidebar structure. This prevents user overwhelm by breaking down massive data requirements into manageable, sequential tasks.
Progress Visibility
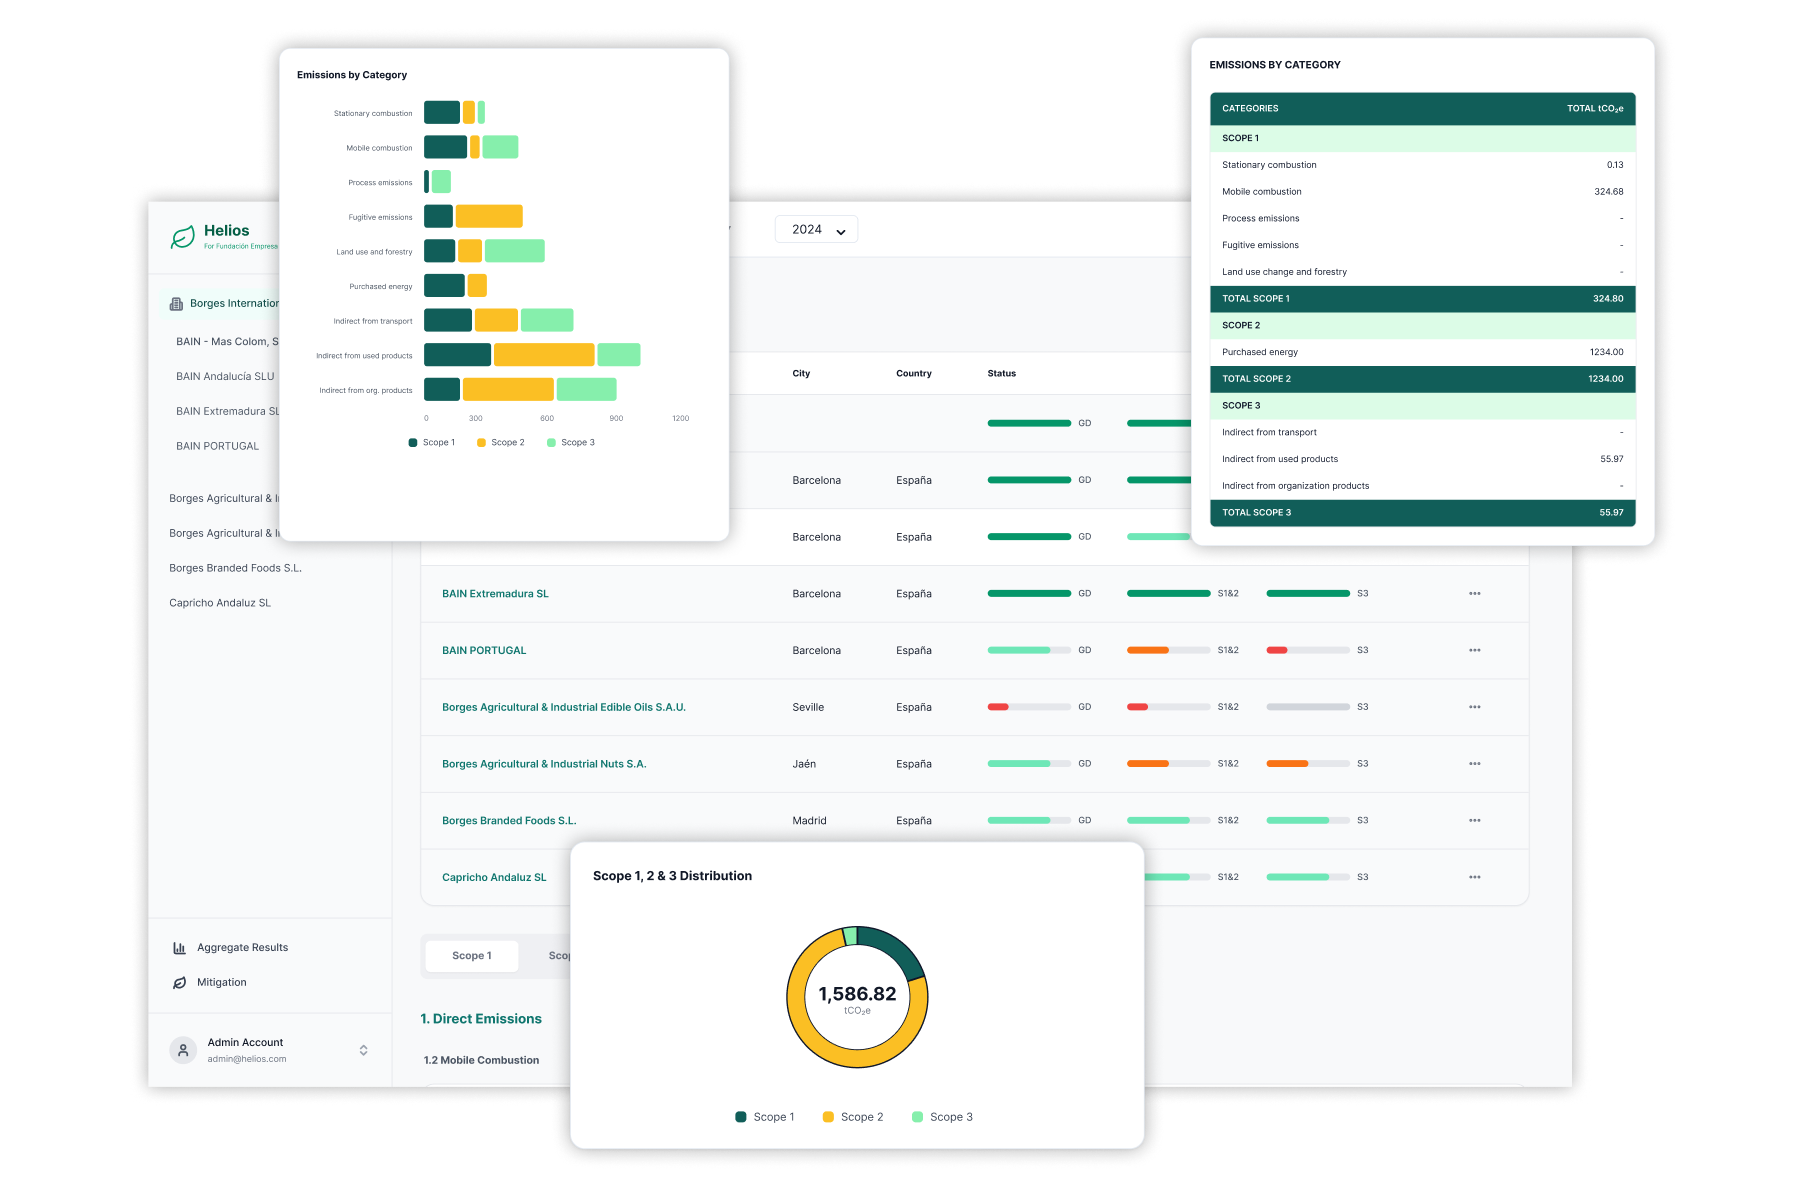
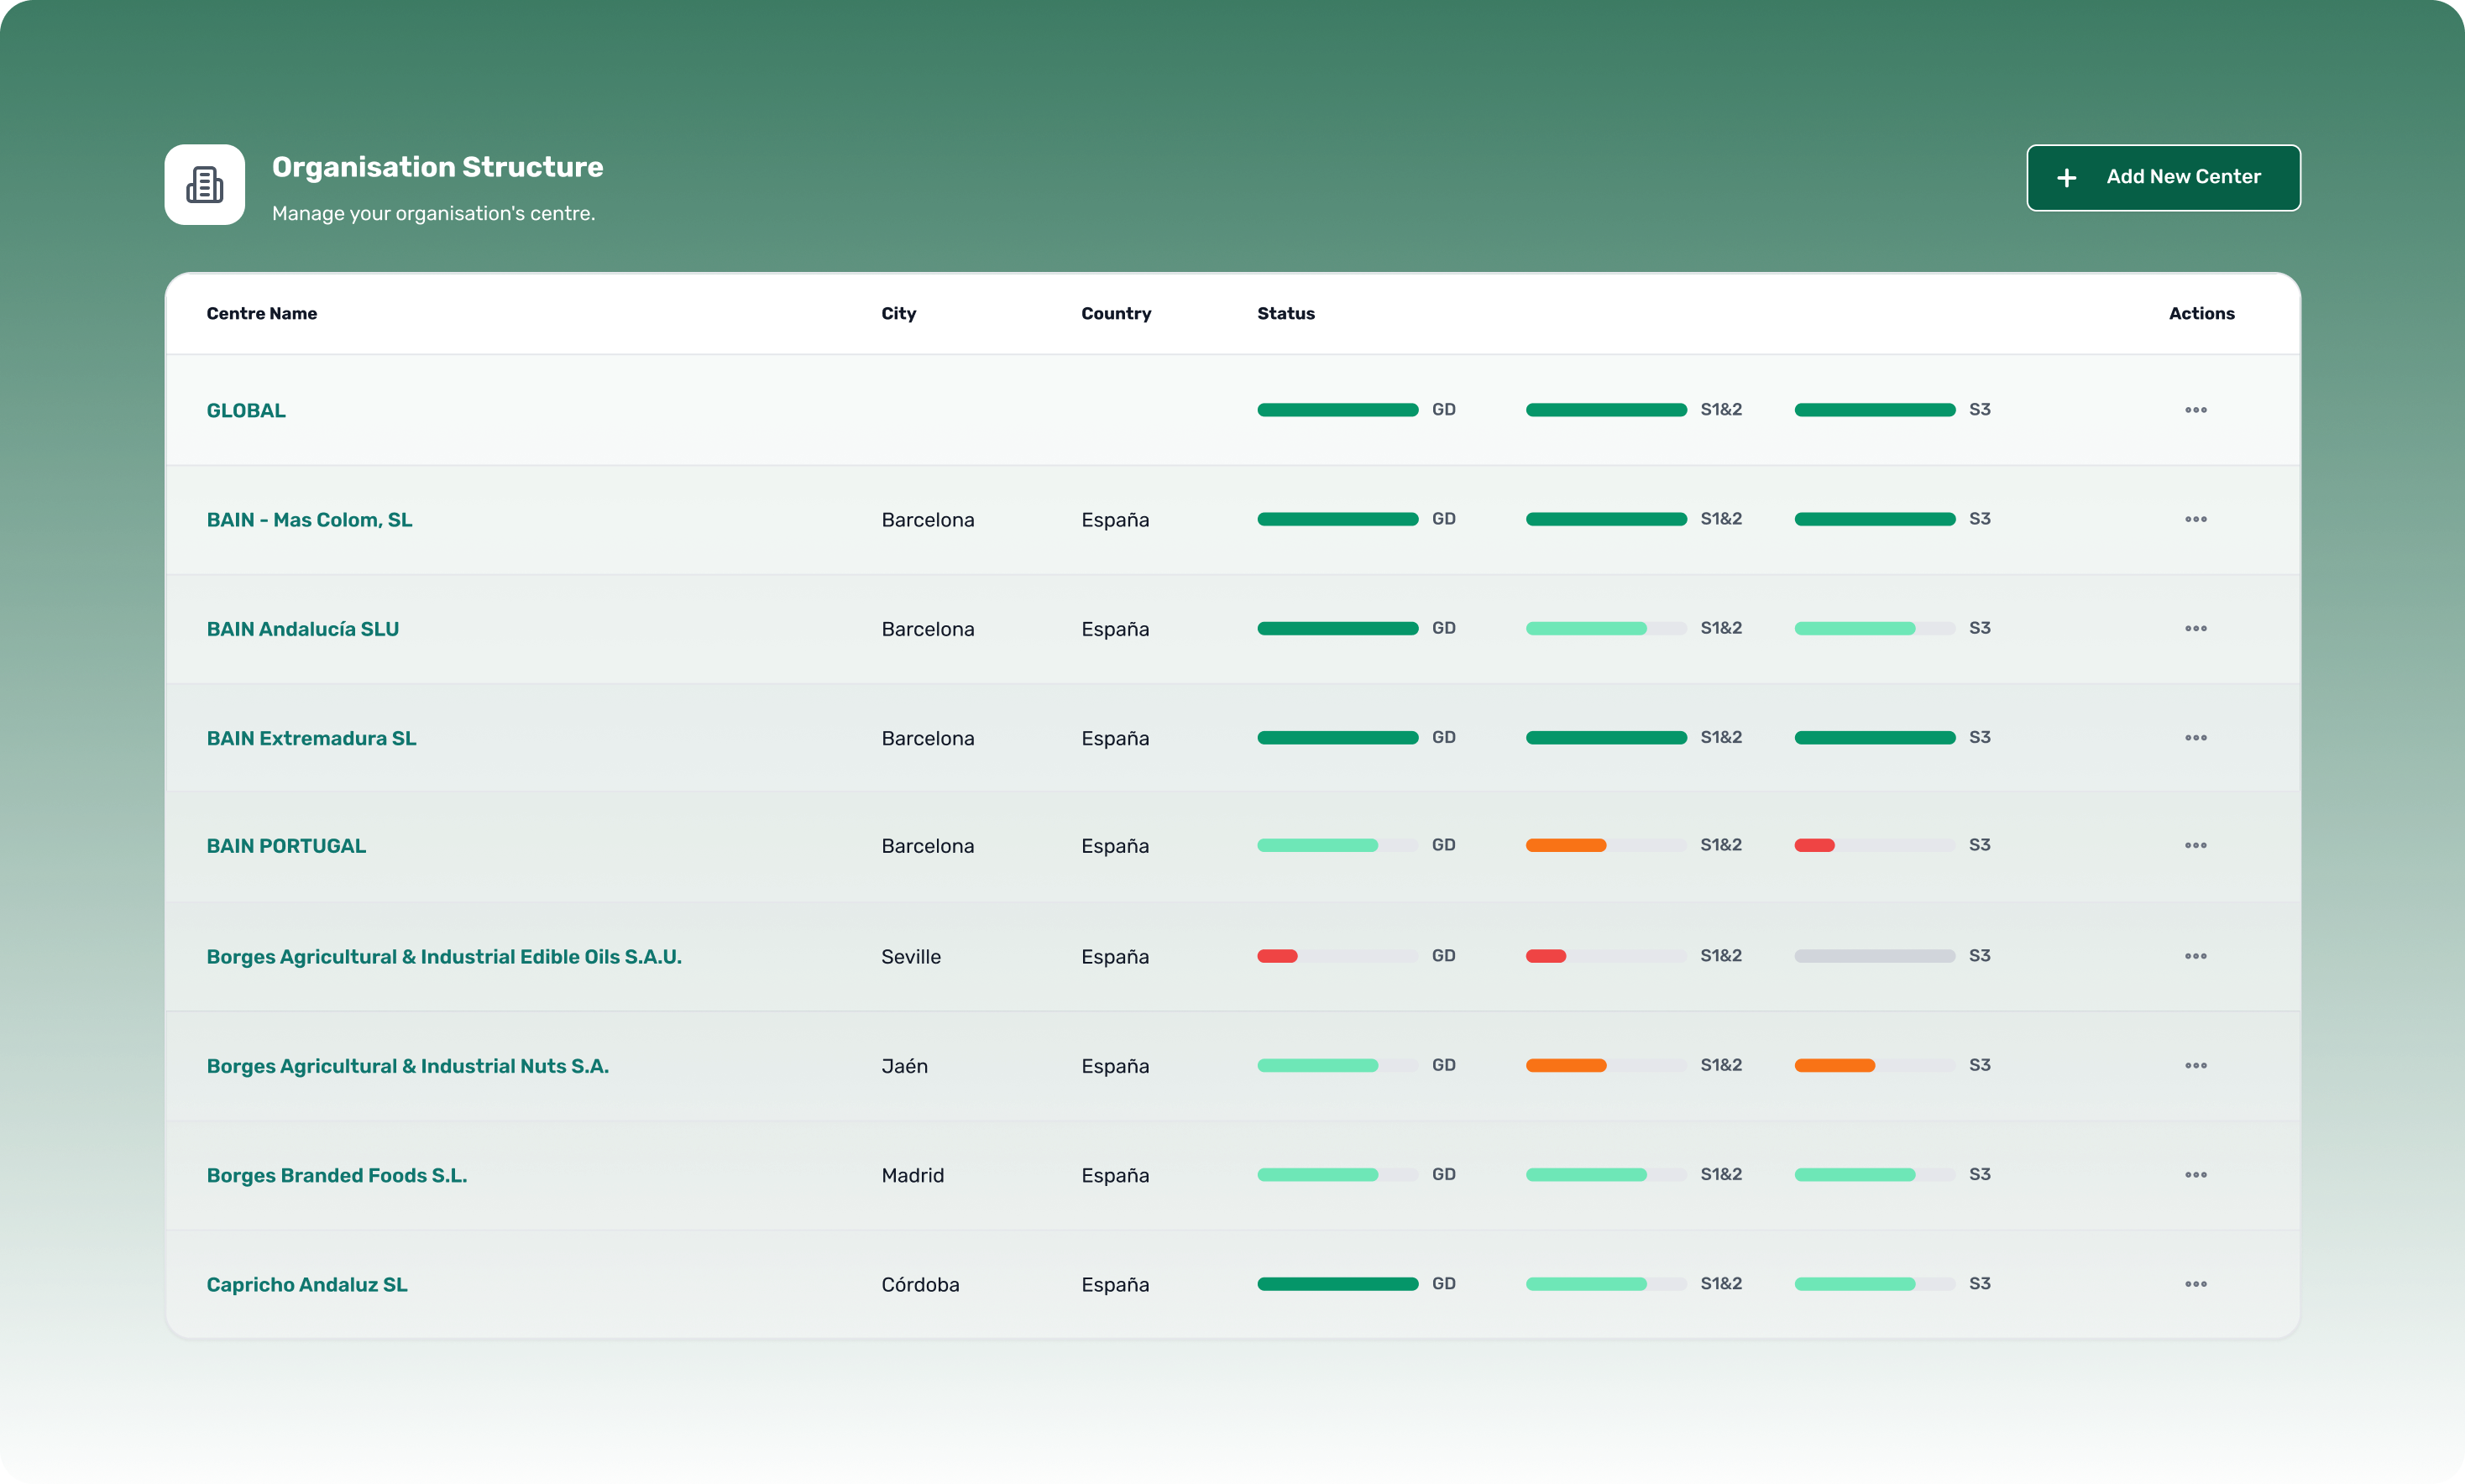
Users previously struggled to track their work. We introduced a 'Traffic Light' status system (Red/Yellow/Green) and progress bars to give immediate feedback on data completeness.
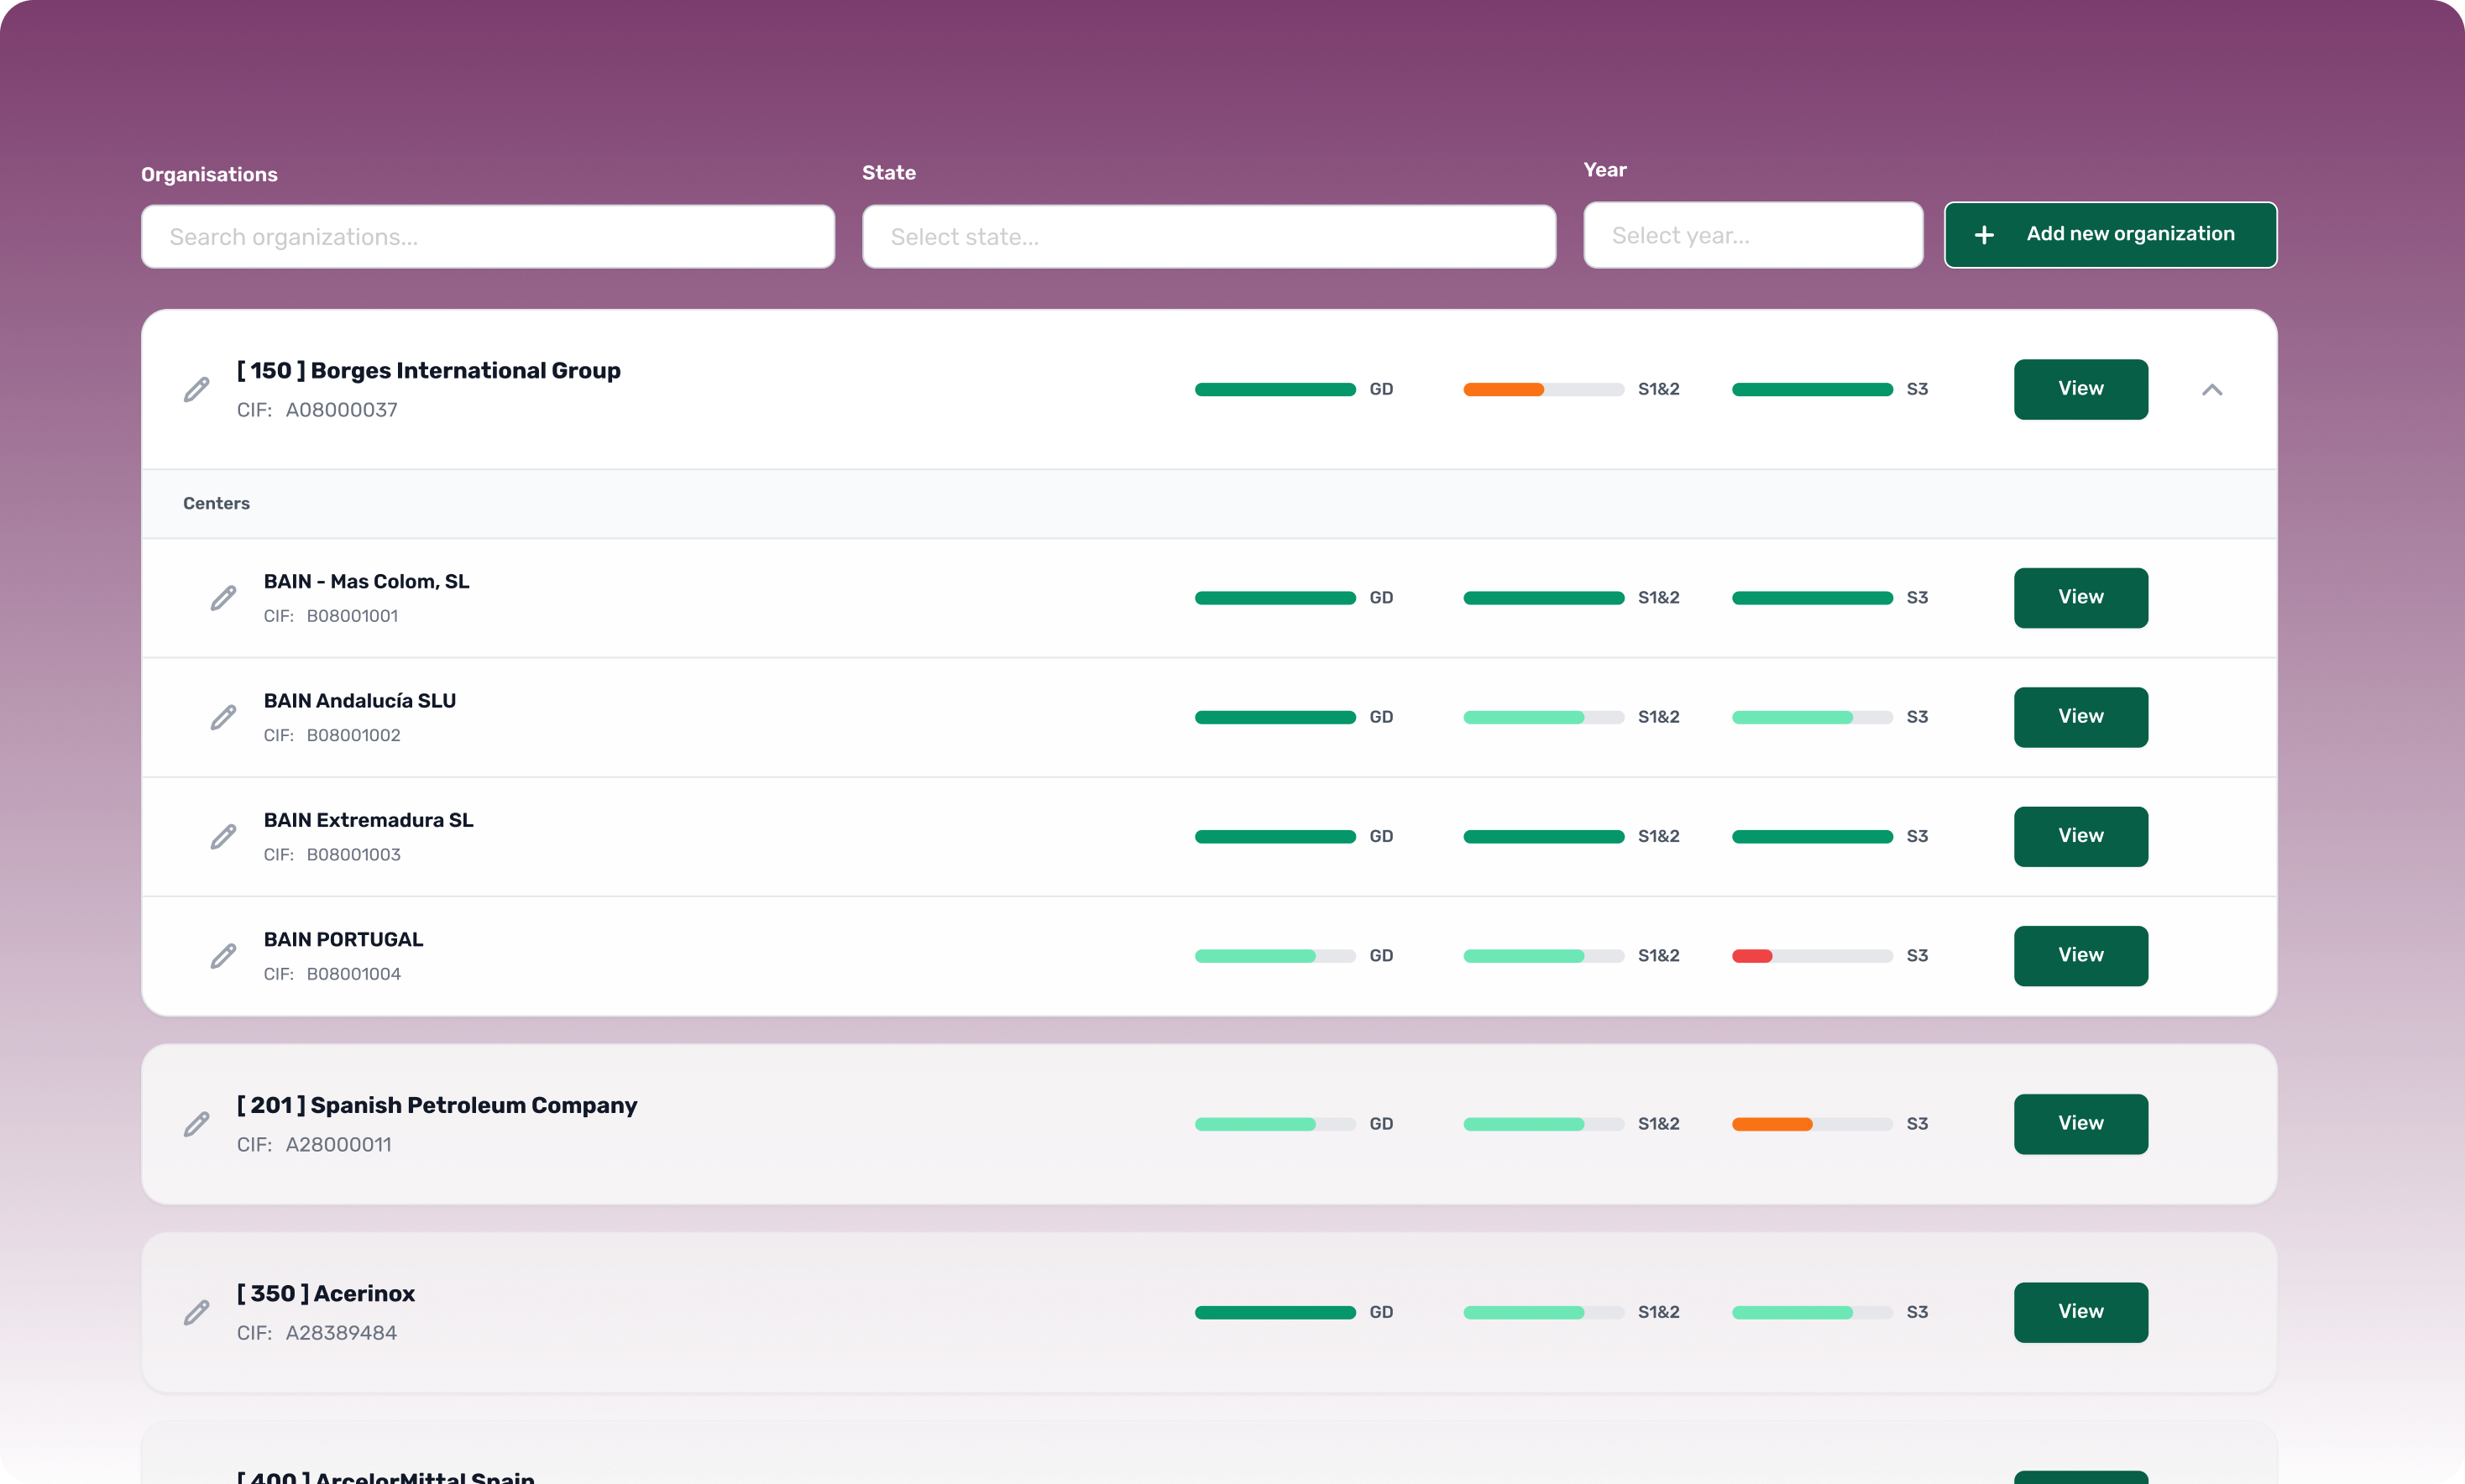
Centralized Oversight
A dedicated view for administrators that aggregates data across all client organizations. This allows the team to monitor compliance and manage permissions from a single dashboard.
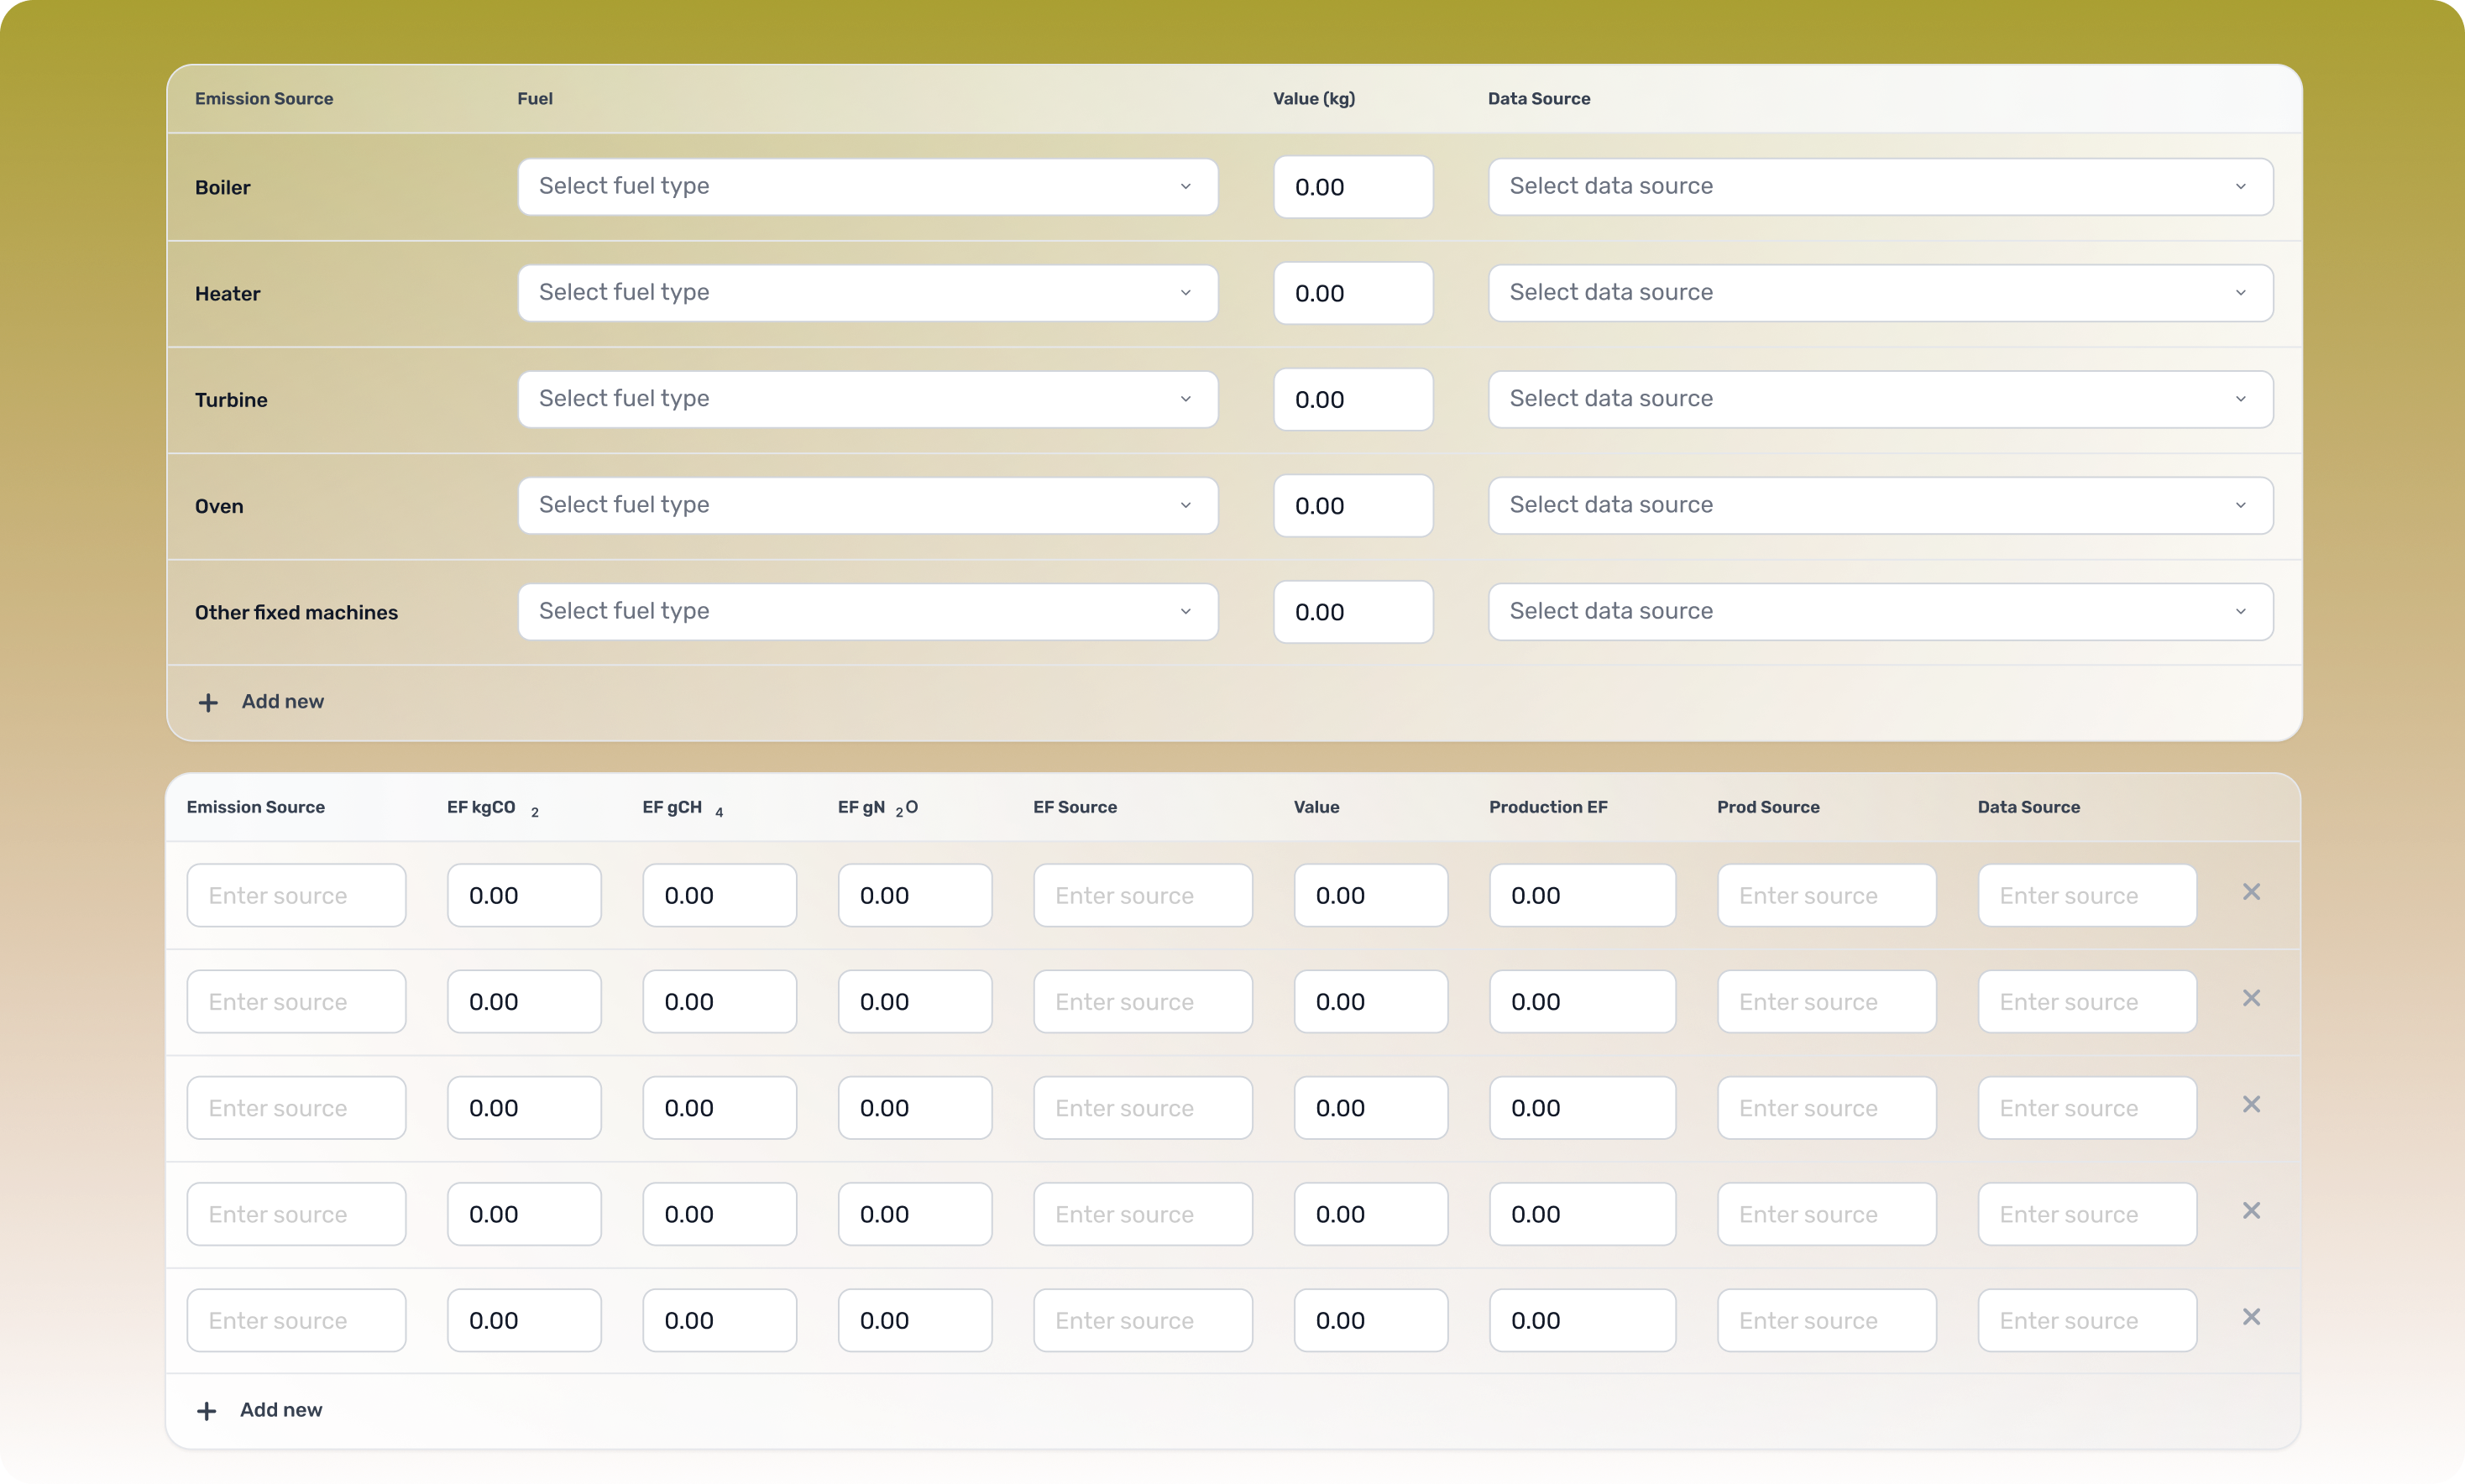
Dynamic Data Entry
Specialized forms for complex categories like Biomass. We utilized conditional logic to hide irrelevant fields, keeping the interface clean and reducing input errors.
The Outcome: Future-Ready & Developer-Friendly
In just a 3-week sprint, we moved Helios from a legacy utility to a modern SaaS product.
Visual Clarity
Raw tables were replaced with an Interactive Results Dashboard, featuring donut charts for Scope distribution and gauge charts for emission intensity.
Seamless Handoff
Because we designed in code, the final deliverable wasn't a set of images—it was a 98% complete React prototype. The lead developer could immediately begin integrating it into the final SvelteKit production environment, saving weeks of frontend development time.
The Verdict: Helios is now as clean as the environment it helps protect.